| From the President and Provost |
|
January 15, 2013,
Volume 59, No. 17 |
Note: To view the tables mentioned in the report, see below or download a PDF of the report here.
The following report updates progress in increasing the presence and improving the experiences of women faculty at Penn since the publication of the comprehensive Gender Equity Report in 2001 and subsequent updates, the last on April 14, 2009.
—Amy Gutmann, President
—Vincent Price, Provost
Progress Report On Gender Equity
Background
This report represents the seventh update in a series that periodically apprises the Penn community on the status of women faculty at the University. These updates follow the publication of a comprehensive analysis undertaken by a joint faculty-administration committee and published in Almanac on December 4, 2001.
The Gender Equity Report and its subsequent updates assess the status of women faculty at Penn along several dimensions: their presence in junior and senior ranks; compensation; hiring and departure activity; and promotion to leadership positions. Prior updates also provided information on central and significant school activities to support the recruitment, retention, promotion, and climate for women. This year’s update is situated in the context of Penn’s recently published Action Plan for Faculty Diversity and Excellence (Almanac July 12, 2011), which has galvanized efforts to attract and retain diverse faculty, including women in fields in which they are underrepresented. This latest update represents an opportunity not only to revisit data relevant to women faculty members’ experiences at Penn but also to showcase some of the excellent work that has been initiated pursuant to the Action Plan.
Summary
Since the last update, Penn has made progress in increasing the proportions of women in all faculty ranks. Overall, the proportion of women rose from 28.4% in 2007 (the most recent data reported in our previous update) to 30.7% in 2011 (Table 1). Proportions of women increased across all ranks, including a steady rise in the percentage of full professors—from 17.5% in fall 2007 to 21.5% in fall 2011. The original Gender Equity Report recommended that the recruitment and retention of senior women be a priority (Almanac December 4, 2001) and we are pleased that we are continuing to make progress. The majority of Penn’s schools—including the Perelman School of Medicine, which accounts for more than half of the Penn standing faculty—experienced increases in women faculty from fall 2007 to fall 2011 (Table 1). Penn now ranks sixth [1] among 17 institutions in an Ivy-Plus group with respect to representation of women among tenure-stream faculty, a slight drop from the fifth place ranking reported in our last update (Table 5). The School of Design, Graduate School of Education, School of Social Policy & Practice, and School of Engineering & Applied Science had small decreases in the proportion of female faculty from fall 2007 to fall 2011 (Table 1). Some of these declines can be attributed to the significant variability in representation in small schools. [2] For example, in the School of Design and the School of Engineering & Applied Science, the decline was less than one percentage point.
Findings of a faculty survey administered during the 2011-2012 academic year, which are discussed later in this update, indicate a generally supportive climate for women. As in prior updates, a report on major programs also follows. Many initiatives in this area have been expanded and others begun under the Action Plan for Faculty Diversity and Excellence.
Trends in Faculty Composition
Headcounts by School
Over the past decade, the proportion of women on Penn’s standing faculty has increased, from 25.6% in 2002 to 30.7% in 2011. Since our last update, the proportion of women on the Penn faculty increased from 28.4% in 2007 to 30.7% in 2011 (Table 1).
The growth in the overall proportion of women on the Penn standing faculty has been driven mainly by the largest schools. In 2007, women comprised 28.6% of the standing faculty in the School of Arts & Sciences. By 2011, the proportion of women had risen to 30.3%, with increases in the percentages of women in all three SAS divisions (humanities, natural sciences, and social sciences). [3] Representation of women faculty grew 3.3% in the Perelman School of Medicine, with increases of 5.2% and 3.0% in the basic sciences and clinical departments, respectively. The Wharton School increased the percentage of women on its standing faculty from 19.3% in 2007 to 21.2% in 2011.
Over time, proportions of women in smaller schools have been more variable. Since our last update, there have been declines in the proportion of women on the standing faculty in the Graduate School of Education (56.1% to 48.4%), School of Social Policy & Practice (55.6% to 46.7%), School of Design (40% to 39.4%), and School of Engineering & Applied Science (12.7% to 12.4%).
The largest increases since our last update have occurred in the Annenberg School for Communication (6.3%), School of Dental Medicine (5.0%), School of Veterinary Medicine (5.0%), Perelman School of Medicine (3.3%), and Law School (3.0%).
Headcounts by Rank and Track
As is true of peer institutions, women continue to be more heavily represented in the junior ranks; however, there have been steady increases in the proportion of women in every faculty rank. Penn’s most recent data also reflect a trend toward increasing percentages of women in the senior faculty ranks. In 2007, women constituted only 17.5% of full professors. As of fall 2011, that percentage had grown to 21.5%. Our previous update reported that 29.7% of associate professors were female, and that proportion has grown to 34.1%. In fall 2011, 41.9% of the untenured ranks were female, up slightly from 41.6% in fall 2007 (Table 2).
The growth in the percentage of women in the tenured ranks is especially heartening given the concerns expressed in the original Gender Equity Report about the retention of senior women, as well as more general concerns about the “leaky” career pipeline for women in academe. The Office of the Provost continues to monitor rates of promotion and has found no pattern of gender differentials in University promotion decisions. Further, women are taking on more leadership positions across the University, a result discussed in detail later in this report.
School and Departmental Variations
Table 3 disaggregates the composition of the faculty by gender, rank, school, and department. In many sectors of the University, there has been substantial progress in adding women to faculty ranks since fall 2007. In a number of areas, women constitute half or more of the standing faculty (Table 3). [4]
Many Penn departments have increased their proportions of female faculty since our last update. [5] These proportions have changed as a result of intensified efforts to recruit and retain women faculty. The School of Nursing has raised its proportion of men, which increases the diversity of its faculty (Tables 2 and 3).
Retention and Turnover
Table 4 shows the proportions and number of women hired from fall 2007 to fall 2011. As would be expected based on the changes reported in Table 1, more of our new faculty hires and fewer of our departures were women. Thirty-eight and a half percent of new faculty hires between 2007 and 2011 were women, as compared to 37.5% between 2003 and 2007. Twenty-nine percent of our departures between 2007 and 2011 were female, as compared to 30% between 2003 and 2007 (Table 4).
This year’s update also provides information on the percentages of hires and departures by school. In the majority of schools, hires outpaced departures between fall 2007 and fall 2011, with three exceptions: Dental Medicine, in which the relatively small number of departures was equivalent to hires; and GSE and SPP, in which the relatively small size of the faculties results in a great deal of variability in percentages hired and departed. While SAS as a whole hired more women than departed between 2007 and 2011, one more woman departed from its natural sciences faculty than was hired. Similarly, the departures of female faculty within the basic science departments of SDM exceeded hires of female faculty by one faculty member.
Peer Comparisons
Table 5 compares Penn’s proportion of female faculty to that of 17 peer institutions. Since the 2009 update, [6] Penn’s ranking for all faculty declined, from 5th to 6th place. For full professors, Penn’s rank improved from 9th to 8th place. The University moved from 5th to a tie for 6th place for associate professors and from 2nd to 8th place for assistant professors. [7]
Academic Base Salaries
The Office of the Provost regularly reviews faculty salaries as part of the annual salary setting process. Each year, proposed out-of-range salary increases must be justified to and approved by the Office of the Provost. At the same time, differences in men’s and women’s salaries within particular departments are examined and, where any significant variances are identified, the Office of the Provost works with deans and chairs to review individual faculty members’ compensation, including time in rank and productivity measures, to make appropriate adjustments. This process of review and adjustment is part of an ongoing effort to ensure that compensation is tied to academic merit, service, and teaching. In addition, salary studies are routinely undertaken for gender equity updates and for the yearly report of the Faculty Senate Committee on the Economic Status of the Faculty.
Annual reports of the Senate Committee on the Economic Status of the Faculty (SCESF) examine, among other things, gender differences in salaries. These SCESF reports have indicated generally higher salaries for men as compared to women of comparable rank, with the differentials generally ranging from 8% to 14%, although these differentials decrease to a range of three to five percentage points when weighted for the proportion of women in a particular department. For the present update, we conducted a regression analysis of academic base salaries for all tenured and tenure-track faculty employed at Penn in fall 2011. Consistent with SCESF reports, the data show raw differentials in pay between males and females on the faculty. Absent controls for any other factors influencing compensation in the model, academic base salaries for women faculty were 17.6% less than those of men faculty. Observed differences in academic base salaries at Penn should be a function of experience, productivity, and discipline. With this information in mind, we identified appropriate and available proxies for factors that are known to influence salary. Once additional variables for discipline, rank, time in rank, and status as an endowed professor and/or department chair were added to the regression model, differences between men’s and women’s salaries declined to 2.6%. The full model explained 81% of the variance in faculty salaries, indicating that data available from University records could not account perfectly for all factors influencing compensation. Most notably, the model lacked indicators of productivity, such as the number of scholarly articles or books published.
As a general matter, salary differences according to gender have decreased over time at Penn. We will continue to work with deans and department chairs to investigate patterns in compensation and to ensure gender equity in faculty salaries.
Women in Leadership Positions
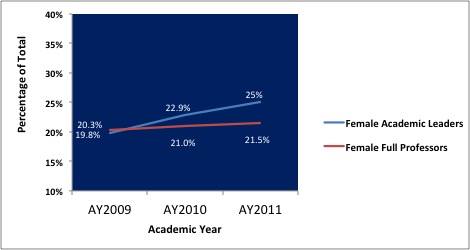
This year’s update includes tables on the representation of women in leadership positions and as holders of endowed chairs. The proportion of women in leadership positions has increased steadily over the years and now exceeds their proportional representation among full professors. By the 2011-2012 academic year, women constituted 25% of academic leaders (defined as deans, department chairs, and associate deans) and 21.5% of full professors (Graph 1). Four of Penn’s 12 deans, 32% of its associate deans, and 19% of department chairs are women. While women’s representation as department chairs still lags their proportion of full professors (21.5%), the proportion of women who are chairs continues to be much greater than the 14.6% in fall 2006 or the 6.5% that the original Gender Equity Committee brought to the University’s attention in 2001. The progress that has been made is important, and our efforts to ensure equitable opportunities to serve in leadership roles and for appointment to endowed chairs continue. [8]
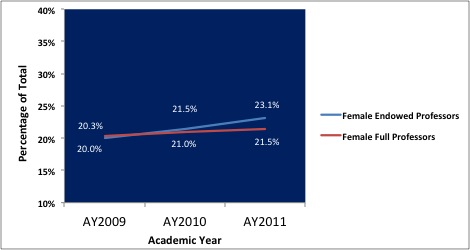
The proportion of women in endowed and term chairs has increased since the original Gender Equity Report and our most recent April 2009 progress report. As of fall 2009, women held 21.9% of the endowed professorships in the University and by fall 2011, that proportion had risen to 23.1% (Graph 2). Women’s representation as holders of endowed chairs now exceeds their proportions in the full professoriate. As of the 2011-2012 academic year, women held 128 of the 553 endowed professorships across the University (23.1%), while they comprised 21.5% of full professors.
Faculty Survey Results
In fall 2011, the University conducted a faculty survey. By the time the survey closed, 73.5% of the standing faculty had responded. The respondents were generally representative of the University by rank, gender, race/ethnicity, and school. University-wide results of the survey can be found at www.upenn.edu/ir/Faculty2011.html
Overall, the levels of satisfaction reported by standing faculty were very high. Nearly 80% of the standing faculty respondents indicated that they were satisfied or very satisfied with being a faculty member at Penn.
Penn’s general climate was rated favorably and more than 75% rated the University to be safe, welcoming, and diverse. High levels of interaction across groups were reported, and a strong majority of the respondents felt that faculty members were respected at Penn regardless of race/ethnicity, gender, sexual orientation, or religious or political beliefs. [9]
Seventy-eight percent of assistant and associate professors reported having been mentored by another faculty member and at least 64% of them said that they had received helpful mentoring. [10] Women were more likely than men to report having been mentored (84% of women compared to 74% of men), and there were no statistically significant differences in perceptions of the helpfulness of mentoring between women and men.
One area of difference between men and women was work-life balance. A number of survey questions addressed workload. Consistent with research findings on work-life balance, women were more likely than men to report “too heavy” or “much too heavy” workloads. [11] When asked to estimate hours spent on domestic responsibilities in a question specifically on this topic, female faculty’s estimates of hours spent on household and family duties were higher than those of their male counterparts. Although men and women reported working roughly equivalent hours per week, respondents were not told how to define work and what sorts of tasks to include in their calculations. [12] There might be individual differences in the way that workload questions were interpreted and answered. Strong majorities of both male and female faculty members who had taken advantage of family-friendly accommodations judged that departments were supportive of workload relief and tenure clock extensions. [13] Women were somewhat less likely than men to feel that they could comfortably raise personal and family responsibilities when scheduling work-related obligations. [14] Small proportions of men and women indicated reluctance to take advantage of family-friendly changes to workloads or the timing of personnel decisions because of concerns about supportiveness of their departments and/or tenure or promotion, and women were more dissuaded than men. [15]
These findings, along with others, continue to be the subject of discussions in meetings of the Council of Deans, department chairs, and Faculty Senate. Going forward, there will be more analysis of these data and conversations with deans and department chairs to address areas of concern.
Recent University Initiatives
Updates to Continuing Initiatives
- Penn continues to participate in the MIT 9 group, an Ivy-Plus collaboration aimed at advancing the recruitment and retention of women in science, technology, engineering, and mathematics (STEM) fields. This year's meeting focused on family-friendly accommodations and the use of faculty and postdoctoral surveys.
- Two of the four Penn Integrates Knowledge Professors appointed since fall 2009 are women.
- Five of the eight Penn Fellows admitted in 2012 are women. The Penn Fellows program is a highly selective leadership development program. More information about the program can be found at www.upenn.edu/provost/penn_fellows
- University funding from the Faculty Opportunity Fund (FOF) has been enhanced as part of the Action Plan for Faculty Diversity and Excellence, with FOF funds now supporting recruits for up to five years (previously the subsidy was for only two years). This subsidy has supported the recruitment of numerous outstanding women faculty to the University.
- Penn continues to participate in a regional higher education recruitment consortium (HERC). HERC is designed in large part to address challenges faced by dual career academic couples, and programming frequently focuses on challenges faced by women in the academy.
- Since the fall of 2008, the Office of the Provost has offered workshops on effective faculty searches to search committee members and other faculty members, with a particular focus on social science research on unconscious bias.
- The University continues to offer new and wide-ranging family-friendly policies and benefits. The most recent addition in this area is the pilot program offering evening childcare at Penn Children's Center, designed in large measure to address the needs of academic women for occasional evening childcare to meet work obligations.
- Penn continues to publicize widely the resources available to faculty members (see for example www.upenn.edu/provost/work_life_balance/ and www.upenn.edu/provost/retirement).
- The University continues to support department chairs and associate deans with workshops organized by the Office of the Provost. During the 2011-2012 academic year, the University began to co-sponsor professional development opportunities, many of which focus on women's leadership development, for underrepresented faculty members with interested schools.
- The Office of the Provost presents an annual award, co-sponsored by the Trustees' Council of Penn Women, to a faculty member who has advanced the role of women in higher education and research at Penn. Professor Ann Matter of the School of Arts & Sciences was the most recent honoree.
- The Penn Forum for Women Faculty, supported by the Office of the Provost, continues to offer professional development programs to build and strengthen networks of women faculty across schools (www.upenn.edu/provost/pfwf).
- The Provost and the Vice Provost for Faculty meet annually with all deans to review data on faculty composition, hiring, promotion, retention, and data specific to women faculty. The agendas for these meetings have now expanded to include information on associated faculty.
- The University continues to award Postdoctoral Fellowships for Academic Diversity to promising scholars and educators from diverse groups whose life experience, research experience, and employment background will contribute significantly to academic excellence. Six of the 10 fellows appointed to date are women.
New Initiatives
- As part of the Action Plan for Faculty Diversity and Excellence launched in the summer of 2011, each of the 12 schools has begun to implement its diversity action plans. The individual school plans detail many excellent new programs and can be viewed on the University's diversity website at: http://diversity.upenn.edu/programs/academic/diversity_offices_school_specific_initiatives%20and%20student_organizations/ Each of the plans addresses issues of gender equity.
- As previously noted, the University administered a faculty survey, in collaboration with the Faculty Senate and the Council of Deans, during the 2011-2012 academic year. Many of the questions were designed to assess gender equality and the climate for women at Penn.
- As part of the Action Plan for Faculty Diversity and Excellence, and funded in part by a grant from The Pew Charitable Trusts, the University began awarding Presidential Term Professorships to outstanding scholars who contribute to the diversity of our faculty. To date, there have been three such appointments. In the future, we anticipate the appointment of approximately two Presidential Term Professors each year. While a woman has not yet been appointed as a Presidential Term Professor, it is anticipated that women will be recruited under this program in the future.
- The University built a new diversity website (http://diversity.upenn.edu/) to highlight inclusion efforts, including gender equity initiatives and the extraordinary contributions of women.
- All 12 schools have appointed "diversity search advisors" to replace the former faculty affirmative action officers. The diversity search advisors will play an active role in faculty searches, including assisting in identifying recruitment sources for women and other underrepresented groups. Twenty-three of the 64 diversity search advisors appointed are women.
- The Action Plan for Faculty Diversity and Excellence created pre-doctoral fellowships for diverse scholars in the social sciences and humanities. Three pre-doctoral fellows—all women—were appointed for academic year 2012-2013 and we anticipate the appointment of at least two new fellows each year.
Moving Forward
The Action Plan for Faculty Diversity and Excellence and other initiatives have helped and will continue to help the University make steady progress in increasing the number and diversity of Penn's faculty by gender. We look forward to continuing to work with the deans and department chairs to increase the number and quality of the experience of the University's women faculty.
[1] Penn was tied with Northwestern in 6th place. The difference between Penn and Brown, the 5th place institution, was only 0.6 of a percentage point.
[2] While the percentages of women in Design and GSE declined, both schools hired more women than departed during the fall 2007-2011 interval. Because of the small sizes of the faculties in Design, GSE, and SPP, small numerical changes can result in significant variation in percentage changes. In SPP, five women departed and one was hired during this period. Although GSE and SPP showed declines in the proportion of female faculty between 2007 and 2011, both schools employ among the highest proportions of female faculty at the University—48.4% and 46.7% respectively.
[3] The most recent update noted a slight dip in the representation of women faculty in the social sciences; however, the most recent data indicate a four percentage point increase in women in the social sciences since 2002.
[4] The areas that contain high proportions of women include the humanities in the School of Arts & Sciences; Anatomy and Cell Biology, Biochemistry, and Preventive and Restorative Science in the School of Dental Medicine; City Planning in the School of Design; the School of Nursing; Biostatistics and Epidemiology, Family Medicine and Community Health, and Obstetrics and Gynecology in the Perelman School of Medicine; Clinical Studies in the School of Veterinary Medicine; and Real Estate in the Wharton School.
[5] Anthropology, Chemistry, Earth and Environmental Science, History, Music, and Sociology in SAS; Anatomy and Cell Biology, Oral Surgery, and Pharmacology in SDM; Architecture and Landscape Architecture in Design; Bioengineering, Chemical and Biomolecular Engineering, and Computer and Information Science in SEAS; Cancer Biology, Cell and Developmental Biology, Dermatology, Genetics, Family Medicine and Community Health, Medicine, Neuroscience, Physiology, Neurology, Neurosurgery, Obstetrics and Gynecology, Ophthalmology, Orthopaedic Surgery, Otorhinolaryngology, Radiation Oncology, and Surgery in PSOM; Clinical Studies (New Bolton) and Pathobiology in SVM; Business Economics and Public Policy, Health Care Management, Legal Studies and Business Ethics, Marketing, Operations and Information Management, Real Estate, and Statistics in Wharton (Table 3). The number of women in the Department of Surgery in the Perelman School of Medicine increased from nine in fall 2007 to 19 in fall 2011. Its proportion of female faculty rose from 10.3% to 20.7%.
[6] The 2009 update relied upon 2007-2008 peer data. Table 5 of this update shows our standing during the 2011-2012 academic year.
[7] Note that the peer rankings included in these reports rely on comparisons of tenure-stream faculty only, excluding clinician-educators. This is done because many peer institutions do not have similar faculty ranks, medical or other health schools. Since our last update, growth in percentages of female clinician-educator assistant professors has offset diminution in the proportion of tenure-stream assistant professors. The exclusion of clinician-educators thus causes Penn's percentage of female assistant professors to drop.
[8] Forty-five percent of the directors of the nine centers reporting to the Provost are women. (Note that two of the centers have co-directors, resulting in a total of eleven directors.)
[9] Eighty-nine percent of respondents agreed or strongly agreed that faculty members are respected at Penn regardless of their gender. Ninety-two percent agreed or strongly agreed with a similar statement about race/ethnicity, and 95% agreed or strongly agreed that faculty members are respected at Penn regardless of sexual orientation.
[10] Eighty-seven percent of standing faculty respondents agreed or strongly agreed that they had received informal mentoring at Penn that was very helpful to them. Sixty-four percent agreed or strongly agreed with an identical statement about formal mentoring.
[11] Fourteen percent of women and 11% of men rated their workload as "much too heavy." Forty-six percent of women and 38% of men described it as "too heavy." The remainder viewed workloads as "about right."
[12] The largest proportion of Penn faculty—62% of women and 60% of men—reported 40 to 60 hours in a typical work week.
[13] Eighty-three percent of faculty respondents who had taken advantage of any form of workload relief rated their departments as somewhat or very supportive. Seventy-nine percent of women responded similarly. Eighty-three percent of all faculty and 82% of women responded that departments were somewhat or very supportive of a tenure clock extension.
[14] Sixty-eight percent of all faculty agreed or strongly agreed with a statement that their departments (or schools, if no department) were places where individual faculty may comfortably raise personal and/or family responsibilities when scheduling work-related obligations. Sixty-one percent of women agreed or strongly agreed with this statement.
[15] Fifteen percent of women and 6% of male faculty respondents indicated that they were eligible for yet did not use workload relief due to concerns about supportiveness of their departments. Twelve percent of female and 6% of male faculty responded that they did not take advantage of workload relief due to concerns about tenure and promotion. Six percent of women and 2% of males who are eligible did not take advantage of a tenure clock extension due to concerns about supportiveness of their departments. Eleven percent of women and 4% of men did not have their clocks slowed because of concerns about tenure or promotion.
Table 1: Trends in Women Standing Faculty Representation by School
(Percentage of Standing Faculty who are Women by School) Fall Semesters 2002-2011 |
School/Academic Division |
2002 |
2003 |
2004 |
2005 |
2006 |
2007 |
2008 |
2009 |
2010 |
2011 |
Difference
2002 to 2011 |
University Total |
25.6% |
26.4% |
27.1% |
26.6% |
27.8% |
28.4% |
28.8% |
29.4% |
30.1% |
30.7% |
5.1% |
Annenberg School for Communication |
26.7% |
33.3% |
33.3% |
31.3% |
35.3% |
37.5% |
41.2% |
47.1% |
50.0% |
43.8% |
17.1% |
Arts & Sciences |
25.3% |
27.1% |
28.5% |
27.5% |
28.7% |
28.6% |
29.3% |
30.0% |
30.2% |
30.3% |
5.0% |
Humanities |
34.6% |
36.9% |
37.9% |
36.2% |
37.1% |
38.5% |
39.1% |
39.8% |
40.2% |
41.0% |
6.4% |
Natural Science |
15.8% |
16.9% |
19.0% |
19.4% |
20.5% |
18.7% |
19.0% |
18.9% |
18.7% |
19.5% |
3.7% |
Social Science |
22.6% |
23.6% |
24.8% |
23.9% |
23.9% |
23.0% |
25.6% |
27.7% |
27.7% |
26.6% |
4.0% |
Dental Medicine |
29.6% |
30.4% |
29.1% |
25.0% |
24.5% |
24.5% |
24.4% |
29.8% |
28.9% |
29.5% |
-0.1% |
Basic Science Departments |
25.0% |
31.6% |
33.3% |
33.3% |
31.3% |
29.4% |
29.4% |
33.3% |
35.3% |
35.3% |
10.3% |
Clinical Departments |
32.4% |
29.7% |
27.0% |
21.2% |
21.2% |
21.9% |
21.4% |
27.6% |
25.0% |
25.9% |
-6.5% |
Design |
28.6% |
30.0% |
33.3% |
38.7% |
37.9% |
40.0% |
41.9% |
38.7% |
37.1% |
39.4% |
10.8% |
Engineering & Applied Science |
9.6% |
10.1% |
10.8% |
9.0% |
9.3% |
12.7% |
13.5% |
13.3% |
13.3% |
12.4% |
2.8% |
Graduate School of Education |
44.4% |
48.6% |
51.4% |
52.5% |
55.6% |
56.1% |
55.0% |
54.1% |
51.4% |
48.4% |
4.0% |
Law School |
21.4% |
20.0% |
20.0% |
17.5% |
20.9% |
20.9% |
21.3% |
22.9% |
25.5% |
23.9% |
2.5% |
Nursing |
95.6% |
95.6% |
94.1% |
93.8% |
92.3% |
92.3% |
90.7% |
90.6% |
90.6% |
91.1% |
-4.5% |
Perelman School of Medicine |
24.3% |
24.6% |
24.6% |
24.2% |
25.3% |
26.1% |
26.5% |
26.9% |
28.3% |
29.4% |
5.1% |
Basic Science Departments |
24.8% |
25.0% |
25.9% |
26.8% |
28.1% |
27.2% |
28.7% |
30.0% |
30.4% |
32.4% |
7.6% |
Clinical Departments |
24.2% |
24.6% |
24.4% |
23.8% |
24.9% |
25.9% |
26.1% |
26.4% |
27.9% |
28.9% |
4.7% |
Social Policy & Practice |
52.9% |
53.3% |
56.3% |
55.6% |
57.9% |
55.6% |
50.0% |
50.0% |
50.0% |
46.7% |
-6.2% |
Veterinary Medicine |
31.0% |
32.1% |
36.4% |
36.6% |
38.4% |
39.4% |
39.7% |
43.4% |
44.4% |
44.4% |
13.4% |
Wharton School |
16.4% |
17.9% |
18.1% |
18.4% |
19.7% |
19.3% |
19.3% |
20.4% |
19.9% |
21.2% |
4.8% |
Excludes executive administrators and deans |
Table 2: Percentage of Standing Faculty by School, Rank, and Gender Status Fall 2011 |
|
All Faculty |
Professor |
Associate |
Assistant |
Total Penn
Faculty |
#
Women |
%
Women |
Total
Penn Faculty |
#
Women |
%
Women |
Total Penn
Faculty |
#
Women |
%
Women |
Total Penn
Faculty |
#
Women |
%
Women |
University Total |
2,501 |
768 |
30.7% |
1,121 |
241 |
21.5% |
654 |
223 |
34.1% |
726 |
304 |
41.9% |
Annenberg School
for Communication |
16 |
7 |
43.8% |
10 |
4 |
40.0% |
2 |
1 |
50.0% |
4 |
2 |
50.0% |
Arts & Sciences Total |
458 |
139 |
30.3% |
245 |
61 |
24.9% |
127 |
43 |
33.9% |
86 |
35 |
40.7% |
Humanities |
195 |
80 |
41.0% |
95 |
34 |
35.8% |
73 |
28 |
38.4% |
27 |
18 |
66.7% |
Natural Science |
154 |
30 |
19.5% |
93 |
13 |
14.0% |
30 |
8 |
26.7% |
31 |
9 |
29.0% |
Social Science |
109 |
29 |
26.6% |
57 |
14 |
24.6% |
24 |
7 |
29.2% |
28 |
8 |
28.6% |
Dental Medicine |
44 |
13 |
29.5% |
20 |
4 |
20.0% |
15 |
5 |
33.3% |
9 |
4 |
44.4% |
Basic Science Departments |
17 |
6 |
35.3% |
11 |
3 |
27.3% |
4 |
3 |
75.0% |
2 |
- |
0.0% |
Clinical Departments |
27 |
7 |
25.9% |
9 |
1 |
11.1% |
11 |
2 |
18.2% |
7 |
4 |
57.1% |
Design |
33 |
13 |
39.4% |
13 |
2 |
15.4% |
6 |
3 |
50.0% |
14 |
8 |
57.1% |
Engineering & Applied Science |
105 |
13 |
12.4% |
62 |
7 |
11.3% |
24 |
4 |
16.7% |
19 |
2 |
10.5% |
Graduate School of Education |
31 |
15 |
48.4% |
17 |
8 |
47.1% |
13 |
7 |
53.8% |
1 |
- |
0.0% |
Law School |
46 |
11 |
23.9% |
41 |
8 |
19.5% |
- |
- |
0.0% |
5 |
3 |
60.0% |
Nursing |
56 |
51 |
91.1% |
19 |
19 |
100.0% |
21 |
17 |
81.0% |
16 |
15 |
93.8% |
Perelman School of Medicine |
1,347 |
396 |
29.4% |
533 |
102 |
19.1% |
353 |
108 |
30.6% |
461 |
186 |
40.3% |
Basic Science Departments |
179 |
58 |
32.4% |
96 |
24 |
25.0% |
45 |
17 |
37.8% |
38 |
17 |
44.7% |
Clinical Departments |
1,168 |
338 |
28.9% |
437 |
78 |
17.8% |
308 |
91 |
29.5% |
423 |
169 |
40.0% |
Social Policy & Practice |
15 |
7 |
46.7% |
7 |
3 |
42.9% |
4 |
3 |
75.0% |
4 |
1 |
25.0% |
Veterinary Medicine |
124 |
55 |
44.4% |
48 |
9 |
18.8% |
41 |
22 |
53.7% |
35 |
24 |
68.6% |
Wharton School |
226 |
48 |
21.2% |
106 |
14 |
13.2% |
48 |
10 |
20.8% |
72 |
24 |
33.3% |
Table 2a: Percentage of Clinician Educators by School, Rank, and Gender Status Fall 2011 |
|
All Faculty |
Professor |
Associate |
Assistant |
|
Total Penn Faculty |
# Women |
% Women |
Total
Penn Faculty |
# Women |
% Women |
Total Penn Faculty |
# Women |
% Women |
Total Penn Faculty |
# Women |
% Women |
University Total |
920 |
348 |
37.8% |
268 |
70 |
26.1% |
277 |
102 |
36.8% |
375 |
176 |
46.9% |
Dental Medicine |
18 |
5 |
27.8% |
2 |
- |
0.0% |
10 |
2 |
20.0% |
6 |
3 |
50.0% |
Basic Science Departments |
1 |
- |
0.0% |
- |
- |
0.0% |
- |
- |
0.0% |
1 |
- |
0.0% |
Clinical Departments |
17 |
5 |
29.4% |
2 |
- |
0.0% |
10 |
2 |
20.0% |
5 |
3 |
60.0% |
Nursing |
18 |
16 |
88.9% |
7 |
7 |
100.0% |
7 |
5 |
71.4% |
4 |
4 |
100.0% |
Perelman School of Medicine |
825 |
285 |
34.5% |
245 |
56 |
22.9% |
235 |
78 |
33.2% |
345 |
151 |
43.8% |
Basic Science Departments |
27 |
18 |
66.7% |
7 |
5 |
71.4% |
11 |
7 |
63.6% |
9 |
6 |
66.7% |
Clinical Departments |
798 |
267 |
33.5% |
238 |
51 |
21.4% |
224 |
71 |
31.7% |
336 |
145 |
43.2% |
Social Policy & Practice |
1 |
1 |
100.0% |
- |
- |
0.0% |
1 |
1 |
100.0% |
- |
- |
0.0% |
Veterinary Medicine |
58 |
41 |
70.7% |
14 |
7 |
50.0% |
24 |
16 |
66.7% |
20 |
18 |
90.0% |
Excludes executive administrators and deans. |
Table 3: Percentage of Standing Faculty by School, Department, and Gender Status Fall 2011 |
|
All Faculty |
Professor |
Associate |
Assistant |
School / Division / Department |
Total Penn
Faculty |
#
Women |
%
Women |
Total Penn
Faculty |
#
Women |
%
Women |
Total Penn
Faculty |
#
Women |
%
Women |
Total Penn Faculty |
#
Women |
%
Women |
University Total |
2,501 |
768 |
30.7% |
1,121 |
241 |
21.5% |
654 |
223 |
34.1% |
726 |
304 |
41.9% |
Annenberg School for Communication |
16 |
7 |
43.8% |
10 |
4 |
40.0% |
2 |
1 |
50.0% |
4 |
2 |
50.0% |
Communication |
16 |
7 |
43.8% |
10 |
4 |
40.0% |
2 |
1 |
50.0% |
4 |
2 |
50.0% |
Arts & Sciences |
458 |
139 |
30.3% |
245 |
61 |
24.9% |
127 |
43 |
33.9% |
86 |
35 |
40.7% |
Humanities |
195 |
80 |
41.0% |
95 |
34 |
35.8% |
73 |
28 |
38.4% |
27 |
18 |
66.7% |
Classical Studies |
13 |
6 |
46.2% |
6 |
3 |
50.0% |
4 |
2 |
50.0% |
3 |
1 |
33.3% |
East Asian Languages and Civilizations |
7 |
4 |
57.1% |
3 |
1 |
33.3% |
2 |
2 |
100.0% |
2 |
1 |
50.0% |
English |
35 |
15 |
42.9% |
19 |
8 |
42.1% |
12 |
3 |
25.0% |
4 |
4 |
100.0% |
German |
7 |
4 |
57.1% |
2 |
1 |
50.0% |
4 |
3 |
75.0% |
1 |
- |
0.0% |
History |
37 |
15 |
40.5% |
18 |
6 |
33.3% |
15 |
5 |
33.3% |
4 |
4 |
100.0% |
History of Art |
17 |
8 |
47.1% |
11 |
5 |
45.5% |
5 |
3 |
60.0% |
1 |
- |
0.0% |
Linguistics |
13 |
2 |
15.4% |
5 |
1 |
20.0% |
6 |
1 |
16.7% |
2 |
- |
0.0% |
Music |
10 |
5 |
50.0% |
6 |
3 |
50.0% |
3 |
1 |
33.3% |
1 |
1 |
100.0% |
Near Eastern Languages and Civilizations |
11 |
2 |
18.2% |
3 |
- |
0.0% |
8 |
2 |
25.0% |
- |
- |
0.0% |
Philosophy |
14 |
6 |
42.9% |
8 |
2 |
25.0% |
4 |
2 |
50.0% |
2 |
2 |
100.0% |
Religious Studies |
6 |
4 |
66.7% |
2 |
1 |
50.0% |
3 |
2 |
66.7% |
1 |
1 |
100.0% |
Romance Languages |
17 |
6 |
35.3% |
10 |
3 |
30.0% |
4 |
1 |
25.0% |
3 |
2 |
66.7% |
Slavic Languages and Literature |
4 |
1 |
25.0% |
2 |
- |
0.0% |
1 |
- |
0.0% |
1 |
1 |
100.0% |
South Asia Studies |
4 |
2 |
50.0% |
- |
- |
0.0% |
2 |
1 |
50.0% |
2 |
1 |
50.0% |
Natural Science |
154 |
30 |
19.5% |
93 |
13 |
14.0% |
30 |
8 |
26.7% |
31 |
9 |
29.0% |
Biology |
31 |
7 |
22.6% |
15 |
3 |
20.0% |
10 |
3 |
30.0% |
6 |
1 |
16.7% |
Chemistry |
29 |
5 |
17.2% |
19 |
3 |
15.8% |
4 |
- |
0.0% |
6 |
2 |
33.3% |
Earth and Environmental Science |
7 |
1 |
14.3% |
2 |
- |
0.0% |
2 |
- |
0.0% |
3 |
1 |
33.3% |
Mathematics |
26 |
2 |
7.7% |
20 |
1 |
5.0% |
4 |
- |
0.0% |
2 |
1 |
50.0% |
Physics and Astronomy |
33 |
5 |
15.2% |
23 |
2 |
8.7% |
5 |
3 |
60.0% |
5 |
- |
0.0% |
Psychology |
28 |
10 |
35.7% |
14 |
4 |
28.6% |
5 |
2 |
40.0% |
9 |
4 |
44.4% |
Social Science |
109 |
29 |
26.6% |
57 |
14 |
24.6% |
24 |
7 |
29.2% |
28 |
8 |
28.6% |
Anthropology |
16 |
4 |
25.0% |
9 |
1 |
11.1% |
4 |
2 |
50.0% |
3 |
1 |
33.3% |
Criminology |
3 |
- |
0.0% |
2 |
- |
0.0% |
1 |
- |
0.0% |
- |
- |
0.0% |
Economics |
31 |
3 |
9.7% |
17 |
1 |
5.9% |
2 |
- |
0.0% |
12 |
2 |
16.7% |
History and Sociology of Science |
8 |
3 |
37.5% |
3 |
2 |
66.7% |
3 |
- |
0.0% |
2 |
1 |
50.0% |
Political Science |
28 |
9 |
32.1% |
14 |
5 |
35.7% |
6 |
2 |
33.3% |
8 |
2 |
25.0% |
Sociology |
23 |
10 |
43.5% |
12 |
5 |
41.7% |
8 |
3 |
37.5% |
3 |
2 |
66.7% |
Dental Medicine |
44 |
13 |
29.5% |
20 |
4 |
20.0% |
15 |
5 |
33.3% |
9 |
4 |
44.4% |
Basic Science Departments |
17 |
6 |
35.3% |
11 |
3 |
27.3% |
4 |
3 |
75.0% |
2 |
- |
0.0% |
Anatomy and Cell Biology |
4 |
3 |
75.0% |
2 |
1 |
50.0% |
2 |
2 |
100.0% |
- |
- |
0.0% |
Biochemistry |
4 |
2 |
50.0% |
3 |
2 |
66.7% |
- |
- |
0.0% |
1 |
- |
0.0% |
Microbiology |
4 |
- |
0.0% |
4 |
- |
0.0% |
- |
- |
0.0% |
- |
- |
0.0% |
Pathology |
5 |
1 |
20.0% |
2 |
- |
0.0% |
2 |
1 |
50.0% |
1 |
- |
0.0% |
Clinical Departments |
27 |
7 |
25.9% |
9 |
1 |
11.1% |
11 |
2 |
18.2% |
7 |
4 |
57.1% |
Endodontics |
2 |
- |
0.0% |
1 |
- |
0.0% |
1 |
- |
0.0% |
- |
- |
0.0% |
Oral Medicine |
5 |
- |
0.0% |
1 |
- |
0.0% |
2 |
- |
0.0% |
2 |
- |
0.0% |
Oral Surgery and Pharmacology |
6 |
2 |
33.3% |
1 |
- |
0.0% |
3 |
- |
0.0% |
2 |
2 |
100.0% |
Orthodontics |
2 |
- |
0.0% |
1 |
- |
0.0% |
1 |
- |
0.0% |
- |
- |
0.0% |
Periodontics |
6 |
2 |
33.3% |
4 |
1 |
25.0% |
1 |
- |
0.0% |
1 |
1 |
100.0% |
Preventive and Restorative Science |
6 |
3 |
50.0% |
1 |
- |
0.0% |
3 |
2 |
66.7% |
2 |
1 |
50.0% |
Design |
33 |
13 |
39.4% |
13 |
2 |
15.4% |
6 |
3 |
50.0% |
14 |
8 |
57.1% |
Architecture |
11 |
4 |
36.4% |
5 |
1 |
20.0% |
2 |
1 |
50.0% |
4 |
2 |
50.0% |
City and Regional Planning |
8 |
4 |
50.0% |
3 |
1 |
33.3% |
- |
- |
0.0% |
5 |
3 |
60.0% |
Fine Arts |
5 |
2 |
40.0% |
2 |
- |
0.0% |
1 |
1 |
100.0% |
2 |
1 |
50.0% |
Historic Preservation |
2 |
- |
0.0% |
1 |
- |
0.0% |
1 |
- |
0.0% |
- |
- |
0.0% |
Landscape Architecture |
7 |
3 |
42.9% |
2 |
- |
0.0% |
2 |
1 |
50.0% |
3 |
2 |
66.7% |
Engineering & Applied Science |
105 |
13 |
12.4% |
62 |
7 |
11.3% |
24 |
4 |
16.7% |
19 |
2 |
10.5% |
Bioengineering |
15 |
2 |
13.3% |
9 |
2 |
22.2% |
3 |
- |
0.0% |
3 |
- |
0.0% |
Chemical and Biomolecular Engineering |
12 |
1 |
8.3% |
7 |
1 |
14.3% |
2 |
- |
0.0% |
3 |
- |
0.0% |
Computer and Information Science |
30 |
3 |
10.0% |
15 |
1 |
6.7% |
10 |
1 |
10.0% |
5 |
1 |
20.0% |
Electrical and Systems Engineering |
23 |
2 |
8.7% |
15 |
1 |
6.7% |
5 |
1 |
20.0% |
3 |
- |
0.0% |
Material Science and Engineering |
11 |
3 |
27.3% |
7 |
2 |
28.6% |
2 |
1 |
50.0% |
2 |
- |
0.0% |
Mechanical Engr. and Applied Mechanics |
14 |
2 |
14.3% |
9 |
- |
0.0% |
2 |
1 |
50.0% |
3 |
1 |
33.3% |
Graduate School of Education |
31 |
15 |
48.4% |
17 |
8 |
47.1% |
13 |
7 |
53.8% |
1 |
- |
0.0% |
Education |
31 |
15 |
48.4% |
17 |
8 |
47.1% |
13 |
7 |
53.8% |
1 |
- |
0.0% |
Law School |
46 |
11 |
23.9% |
41 |
8 |
19.5% |
- |
- |
0.0% |
5 |
3 |
60.0% |
Law |
46 |
11 |
23.9% |
41 |
8 |
19.5% |
- |
- |
0.0% |
5 |
3 |
60.0% |
Nursing |
56 |
51 |
91.1% |
19 |
19 |
100.0% |
21 |
17 |
81.0% |
16 |
15 |
93.8% |
Biobehavioral and Health Sciences |
29 |
27 |
93.1% |
8 |
8 |
100.0% |
13 |
11 |
84.6% |
8 |
8 |
100.0% |
Family and Community Health |
27 |
24 |
88.9% |
11 |
11 |
100.0% |
8 |
6 |
75.0% |
8 |
7 |
87.5% |
Perelman School of Medicine |
1,347 |
396 |
29.4% |
533 |
102 |
19.1% |
353 |
108 |
30.6% |
461 |
186 |
40.3% |
Basic Science Departments |
179 |
58 |
32.4% |
96 |
24 |
25.0% |
45 |
17 |
37.8% |
38 |
17 |
44.7% |
Biochemistry and Biophysics |
20 |
4 |
20.0% |
13 |
1 |
7.7% |
4 |
2 |
50.0% |
3 |
1 |
33.3% |
Biostatistics and Epidemiology |
42 |
22 |
52.4% |
14 |
6 |
42.9% |
15 |
8 |
53.3% |
13 |
8 |
61.5% |
Cancer Biology |
10 |
2 |
20.0% |
4 |
- |
0.0% |
2 |
- |
0.0% |
4 |
2 |
50.0% |
Cell and Development Biology |
20 |
6 |
30.0% |
11 |
5 |
45.5% |
5 |
- |
0.0% |
4 |
1 |
25.0% |
Genetics |
13 |
6 |
46.2% |
6 |
3 |
50.0% |
5 |
3 |
60.0% |
2 |
- |
0.0% |
Medical Ethics |
4 |
1 |
25.0% |
2 |
- |
0.0% |
2 |
1 |
50.0% |
- |
- |
0.0% |
Microbiology |
20 |
7 |
35.0% |
12 |
4 |
33.3% |
3 |
- |
0.0% |
5 |
3 |
60.0% |
Neuroscience |
13 |
4 |
30.8% |
7 |
2 |
28.6% |
5 |
1 |
20.0% |
1 |
1 |
100.0% |
Pharmacology |
19 |
2 |
10.5% |
13 |
1 |
7.7% |
3 |
1 |
33.3% |
3 |
- |
0.0% |
Physiology |
18 |
4 |
22.2% |
14 |
2 |
14.3% |
1 |
1 |
100.0% |
3 |
1 |
33.3% |
Clinical Departments |
1,168 |
338 |
28.9% |
437 |
78 |
17.8% |
308 |
91 |
29.5% |
423 |
169 |
40.0% |
Anesthesia |
66 |
13 |
19.7% |
15 |
1 |
6.7% |
20 |
3 |
15.0% |
31 |
9 |
29.0% |
Dermatology |
23 |
9 |
39.1% |
9 |
3 |
33.3% |
5 |
3 |
60.0% |
9 |
3 |
33.3% |
Emergency Medicine |
31 |
12 |
38.7% |
7 |
2 |
28.6% |
12 |
5 |
41.7% |
12 |
5 |
41.7% |
Family Medicine and Community Health |
10 |
6 |
60.0% |
2 |
2 |
100.0% |
2 |
2 |
100.0% |
6 |
2 |
33.3% |
Medicine |
247 |
64 |
25.9% |
97 |
13 |
13.4% |
70 |
21 |
30.0% |
80 |
30 |
37.5% |
Neurology |
52 |
13 |
25.0% |
21 |
1 |
4.8% |
11 |
3 |
27.3% |
20 |
9 |
45.0% |
Neurosurgery |
18 |
1 |
5.6% |
7 |
- |
0.0% |
4 |
- |
0.0% |
7 |
1 |
14.3% |
Obstetrics and Gynecology |
24 |
14 |
58.3% |
8 |
1 |
12.5% |
6 |
5 |
83.3% |
10 |
8 |
80.0% |
Ophthalmology |
23 |
6 |
26.1% |
9 |
3 |
33.3% |
7 |
- |
0.0% |
7 |
3 |
42.9% |
Orthopedic Surgery |
30 |
3 |
10.0% |
11 |
1 |
9.1% |
9 |
- |
0.0% |
10 |
2 |
20.0% |
Otorhinolaryngology |
29 |
7 |
24.1% |
11 |
2 |
18.2% |
6 |
- |
0.0% |
12 |
5 |
41.7% |
Pathology |
92 |
23 |
25.0% |
53 |
9 |
17.0% |
24 |
8 |
33.3% |
15 |
6 |
40.0% |
Pediatrics |
215 |
97 |
45.1% |
79 |
26 |
32.9% |
55 |
26 |
47.3% |
81 |
45 |
55.6% |
Psychiatry |
81 |
19 |
23.5% |
27 |
3 |
11.1% |
29 |
7 |
24.1% |
25 |
9 |
36.0% |
Radiation Oncology |
38 |
7 |
18.4% |
8 |
2 |
25.0% |
5 |
- |
0.0% |
25 |
5 |
20.0% |
Radiology |
91 |
23 |
25.3% |
36 |
7 |
19.4% |
25 |
6 |
24.0% |
30 |
10 |
33.3% |
Rehabilitation Medicine |
6 |
2 |
33.3% |
2 |
1 |
50.0% |
2 |
- |
0.0% |
2 |
1 |
50.0% |
Surgery |
92 |
19 |
20.7% |
35 |
1 |
2.9% |
16 |
2 |
12.5% |
41 |
16 |
39.0% |
Social Policy & Practice |
15 |
7 |
46.7% |
7 |
3 |
42.9% |
4 |
3 |
75.0% |
4 |
1 |
25.0% |
Social Policy & Practice |
15 |
7 |
46.7% |
7 |
3 |
42.9% |
4 |
3 |
75.0% |
4 |
1 |
25.0% |
Veterinary Medicine |
124 |
55 |
44.4% |
48 |
9 |
18.8% |
41 |
22 |
53.7% |
35 |
24 |
68.6% |
Clinical Studies-New Bolton Center |
34 |
17 |
50.0% |
11 |
1 |
9.1% |
14 |
7 |
50.0% |
9 |
9 |
100.0% |
Clinical Studies-Philadelphia |
37 |
20 |
54.1% |
14 |
5 |
35.7% |
12 |
8 |
66.7% |
11 |
7 |
63.6% |
Pathobiology |
30 |
14 |
46.7% |
13 |
3 |
23.1% |
8 |
4 |
50.0% |
9 |
7 |
77.8% |
Vet Animal Biology |
23 |
4 |
17.4% |
10 |
- |
0.0% |
7 |
3 |
42.9% |
6 |
1 |
16.7% |
Wharton School |
226 |
48 |
21.2% |
106 |
14 |
13.2% |
48 |
10 |
20.8% |
72 |
24 |
33.3% |
Accounting |
19 |
4 |
21.1% |
9 |
1 |
11.1% |
3 |
1 |
33.3% |
7 |
2 |
28.6% |
Business Economics and Public Policy |
16 |
5 |
31.3% |
6 |
2 |
33.3% |
2 |
- |
0.0% |
8 |
3 |
37.5% |
Finance |
44 |
5 |
11.4% |
17 |
1 |
5.9% |
7 |
1 |
14.3% |
20 |
3 |
15.0% |
Health Care Management |
8 |
2 |
25.0% |
4 |
1 |
25.0% |
1 |
- |
0.0% |
3 |
1 |
33.3% |
Legal Studies & Bus. Ethics |
19 |
6 |
31.6% |
9 |
2 |
22.2% |
5 |
1 |
20.0% |
5 |
3 |
60.0% |
Management |
41 |
8 |
19.5% |
18 |
3 |
16.7% |
11 |
3 |
27.3% |
12 |
2 |
16.7% |
Marketing |
27 |
7 |
25.9% |
15 |
1 |
6.7% |
5 |
2 |
40.0% |
7 |
4 |
57.1% |
Operations and
Information Management |
23 |
4 |
17.4% |
13 |
1 |
7.7% |
6 |
- |
0.0% |
4 |
3 |
75.0% |
Real Estate |
8 |
4 |
50.0% |
3 |
2 |
66.7% |
2 |
- |
0.0% |
3 |
2 |
66.7% |
Statistics |
21 |
3 |
14.3% |
12 |
- |
0.0% |
6 |
2 |
33.3% |
3 |
1 |
33.3% |
Table 4—School Detail: Number of Faculty Departed, Hired and Continuing by Gender Status Fall 2007-Fall 2011 |
|
Departed |
Hired |
Continuing |
|
Total Penn Faculty |
#
Women |
%
Women |
Total Penn Faculty |
#
Women |
%
Women |
Total Penn
Faculty |
#
Women |
%
Women |
University Total |
686 |
199 |
29.0% |
741 |
285 |
38.5% |
1,822 |
507 |
27.8% |
Annenberg School for Communication |
3 |
1 |
33.3% |
4 |
2 |
50.0% |
12 |
5 |
41.7% |
Arts & Sciences |
125 |
31 |
24.8% |
105 |
34 |
32.4% |
360 |
107 |
29.7% |
Humanities |
47 |
17 |
36.2% |
34 |
19 |
55.9% |
162 |
62 |
38.3% |
Natural Science |
35 |
9 |
25.7% |
37 |
8 |
21.6% |
120 |
23 |
19.2% |
Social Science |
43 |
5 |
11.6% |
34 |
7 |
20.6% |
78 |
22 |
28.2% |
Dental Medicine |
14 |
4 |
28.6% |
9 |
4 |
44.4% |
37 |
10 |
27.0% |
Basic Science Departments |
1 |
0 |
0.0% |
2 |
1 |
50.0% |
15 |
5 |
33.3% |
Clinical Departments |
13 |
4 |
30.8% |
7 |
3 |
42.9% |
22 |
5 |
22.7% |
Design |
10 |
3 |
30.0% |
13 |
5 |
38.5% |
20 |
8 |
40.0% |
Engineering |
15 |
1 |
6.7% |
23 |
5 |
21.7% |
84 |
9 |
10.7% |
Graduate School of Education |
13 |
9 |
69.2% |
7 |
4 |
57.1% |
24 |
11 |
45.8% |
Law School |
8 |
1 |
12.5% |
11 |
3 |
27.3% |
35 |
8 |
22.9% |
Nursing |
17 |
16 |
94.1% |
21 |
19 |
90.5% |
35 |
32 |
91.4% |
Perelman School of Medicine |
375 |
100 |
26.7% |
442 |
172 |
38.9% |
949 |
243 |
25.6% |
Basic Science Departments |
28 |
6 |
21.4% |
34 |
16 |
47.1% |
144 |
42 |
29.2% |
Clinical Departments |
347 |
94 |
27.1% |
408 |
156 |
38.2% |
805 |
201 |
25.0% |
Social Policy & Practice |
8 |
5 |
62.5% |
4 |
1 |
25.0% |
11 |
6 |
54.5% |
Veterinary Medicine |
35 |
11 |
31.4% |
21 |
13 |
61.9% |
104 |
42 |
40.4% |
Wharton School |
63 |
17 |
27.0% |
81 |
23 |
28.4% |
151 |
26 |
17.2% |
Table 4a: Number of Faculty Departed, Hired and Continuing by Rank and Gender Status Fall 2007-Fall 2011 |
|
Departed |
Hired |
Continuing |
|
Total Penn Faculty |
#
Women |
%
Women |
Total Penn Faculty |
#
Women |
%
Women |
Total Penn Faculty |
#
Women |
%
Women |
Professor |
245 |
44 |
18.0% |
78 |
24 |
30.8% |
1,037 |
215 |
20.7% |
Associate |
100 |
22 |
22.0% |
76 |
27 |
35.5% |
575 |
195 |
33.9% |
Assistant |
341 |
133 |
39.0% |
587 |
234 |
39.9% |
210 |
97 |
46.2% |
University |
686 |
199 |
29.0% |
741 |
285 |
38.5% |
1,822 |
507 |
27.8% |
Table 5: Percentage of Women among Full-time Tenure Stream Faculty at Peer Institutions |
|
All Faculty |
Professor |
Associate |
Assistant |
Penn |
29.4% |
22.4% |
35.3% |
39.6% |
Rank of Penn among peers |
6 of 17, tied w/ Northwestern |
8 of 17 |
6 of 17 |
8 of 17 |
Brown |
30.0% |
23.7% |
34.5% |
43.6% |
Chicago |
26.2% |
20.5% |
34.0% |
33.1% |
Columbia |
28.6% |
23.1% |
33.9% |
41.3% |
Cornell |
24.8% |
19.0% |
35.2% |
27.6% |
Dartmouth |
34.6% |
28.2% |
38.6% |
42.2% |
Duke |
26.8% |
21.7% |
34.0% |
33.8% |
Georgetown |
36.2% |
26.0% |
42.5% |
49.6% |
Harvard |
26.9% |
22.8% |
37.1% |
35.3% |
MIT |
21.5% |
16.5% |
26.5% |
34.6% |
Northwestern |
29.4% |
22.7% |
34.1% |
39.7% |
Princeton |
25.7% |
20.3% |
28.8% |
38.5% |
Rice |
25.6% |
18.1% |
34.5% |
35.5% |
Rochester |
27.2% |
18.6% |
34.1% |
36.5% |
Stanford |
25.3% |
20.8% |
30.0% |
35.3% |
Washington University |
30.8% |
22.0% |
39.0% |
40.3% |
Yale |
32.0% |
26.1% |
39.1% |
43.9% |
|